はじめに
前回は JavaFX の環境構築についてのポストでした。
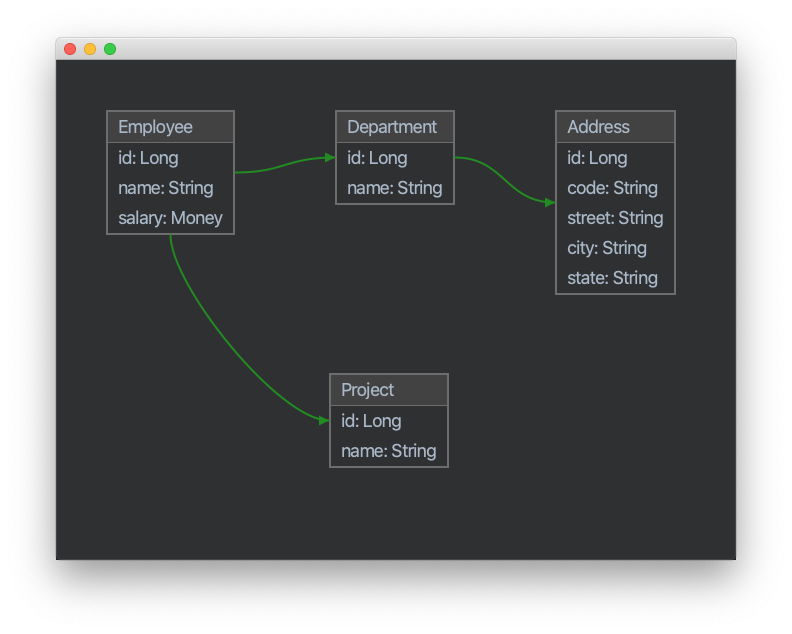
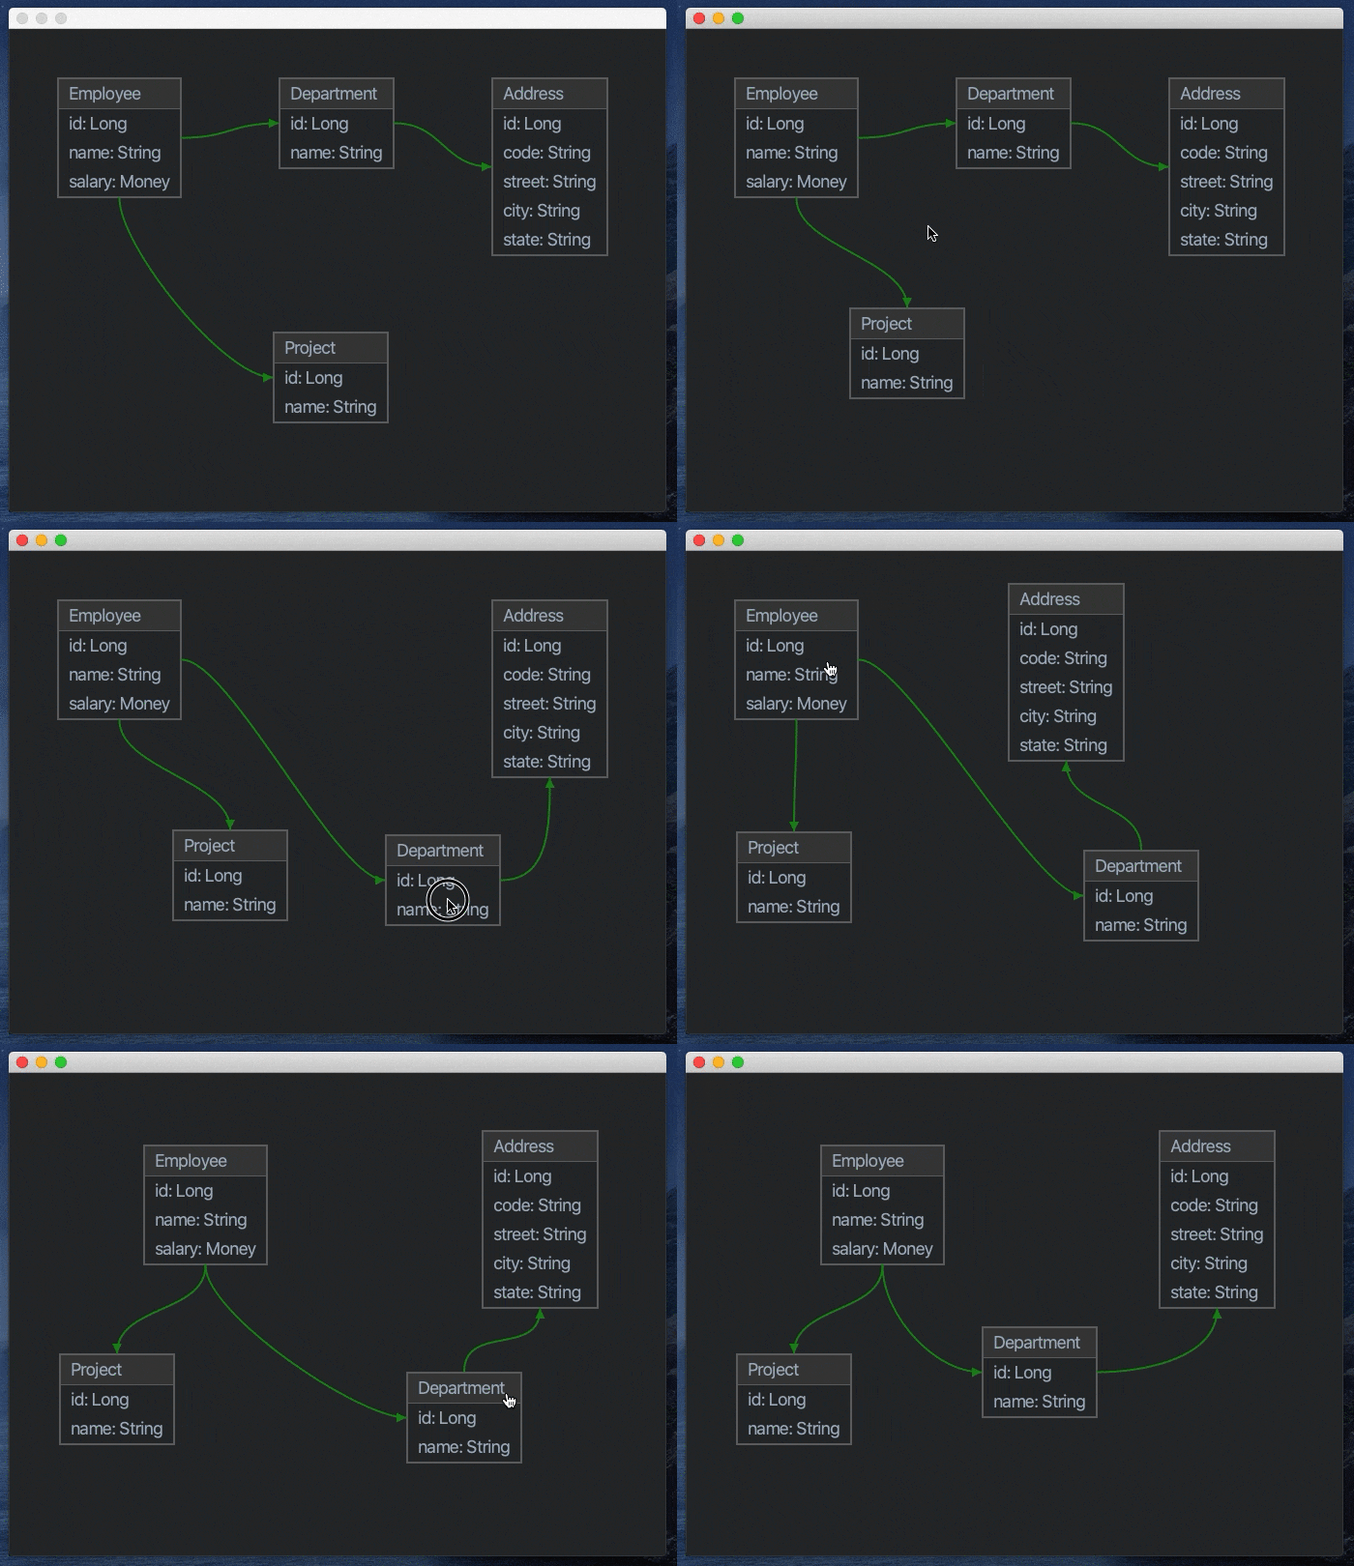
今回は、JavaFX により、上記のような簡単なダイアグラムを表示するまでを、チュートリアル形式で説明します。
マウスドラッグ可能なダイアグラムの作成
最初に箱だけのダイアグラムを表示し、マウスでドラックできるようにしてみましょう。
前回の記事の内容に続いて、Diagram を以下のように作成します。
package example.javafx;

import javafx.geometry.Bounds;
import javafx.scene.Cursor;
import javafx.scene.Node;
import javafx.scene.layout.Pane;

public class Diagram extends Pane {

    public Diagram(Node node) {
        super(node);
        enableDrag();
    }

    private void enableDrag() {

        final Delta dragDelta = new Delta();

        setOnMousePressed(e -> {
            dragDelta.x = getBoundsInParent().getMinX() - e.getScreenX();
            dragDelta.y = getBoundsInParent().getMinY() - e.getScreenY();
            getScene().setCursor(Cursor.MOVE);
        });

        setOnMouseDragged(e -> {
            Bounds bounds = getBoundsInParent();
            double newX = e.getScreenX() + dragDelta.x;
            if (newX > 0 && newX + bounds.getWidth() < getScene().getWidth()) {
                setLayoutX(newX);
            }
            double newY = e.getScreenY() + dragDelta.y;
            if (newY > 0 && newY + bounds.getHeight() < getScene().getHeight()) {
                setLayoutY(newY);
            }
        });

        setOnMouseReleased(e -> getScene().setCursor(Cursor.HAND));

        setOnMouseEntered(e -> {
            if (!e.isPrimaryButtonDown()) {
                getScene().setCursor(Cursor.HAND);
            }
        });

        setOnMouseExited(e -> {
            if (!e.isPrimaryButtonDown()) {
                getScene().setCursor(Cursor.DEFAULT);
            }
        });
    }

    static class Delta { double x, y; }

}
Diagram の中身に表示するコンテンツは別途作成するものとして、ダイアグラムを入れ物として Pane を継承して作成しました。
setOnMousePressed() では、マウスのボタンが押された時の操作を定義しています。ドラッグ開始の起点を Delta として記録し、マウスカーソルを変更しているだけの処理になります。
setOnMouseDragged() では、ドラッグ操作時に Diagram の位置を変更する処理を定義しています。画面からはみ出さない範囲で Diagram の表示位置を変更しています。
その他はマウスカーソルの表示を処理しているだけです。
最初のダイアグラムの表示
作成した Diagram を表示してみましょう。
App クラスを以下のように変更します。
package example.javafx;

import javafx.application.Application;
import javafx.scene.Scene;
import javafx.scene.control.Label;
import javafx.scene.layout.Pane;
import javafx.scene.paint.Color;
import javafx.scene.text.Font;
import javafx.stage.Stage;

public class App extends Application {

    @Override
    public void start(Stage stage) {

        Pane canvas = new Pane();
        canvas.setStyle("-fx-background-color: #2e3032;");

        Diagram d = createDiagram("Diagram");
        canvas.getChildren().add(d);

        Scene scene = new Scene(canvas, 320, 240);
        stage.setScene(scene);
        stage.show();
    }

    private Diagram createDiagram(String name) {
        Label label = new Label(name);
        label.setFont(new Font(18));
        label.setTextFill(Color.WHITESMOKE);

        Diagram d = new Diagram(label);
        d.setStyle(
                "-fx-background-color: #424242;" +
                "-fx-border-color: #6d6d6d;" +
                "-fx-border-width: 2;");
        return d;
    }

    public static void main(String[] args) {
        launch();
    }
}
createDiagram() にてダイアグラムに Lable を追加したものを生成し、canvas に追加しています。
早速実行してみましょう。
$ ./gradlew run
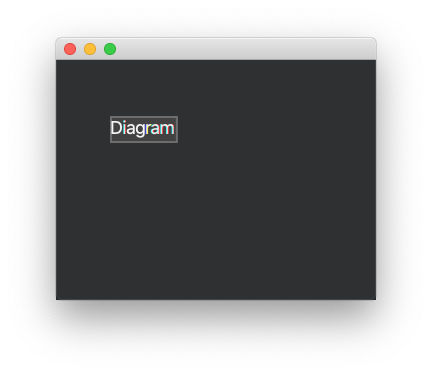
以下のように初期のダイアグラムが表示されます。

ダイアグラムはマウスでドラッグで位置を変更することができます。
ダイアグラムを繋ぐコネクタの作成
続いて、ダイアグラムをコネクタで連結できるようにしていきます。
最初に、コネクタの始点と終点を表す Anchor を作成します。
package example.javafx;

import javafx.beans.property.ReadOnlyDoubleProperty;
import javafx.beans.property.ReadOnlyDoubleWrapper;
import javafx.geometry.Bounds;
import javafx.geometry.Point2D;
import javafx.scene.Node;

public abstract class Anchor {

    protected ReadOnlyDoubleWrapper x = new ReadOnlyDoubleWrapper();
    protected ReadOnlyDoubleWrapper y = new ReadOnlyDoubleWrapper();

    protected Anchor(Node node) {
        calcCenter(node.getBoundsInParent());
        node.boundsInParentProperty().addListener(
                (observableValue, oldBounds, bounds) -> calcCenter(bounds));
    }

    public static Anchor topOf(Node node) {
        return new TopAnchor(node);
    }
    public static Anchor rightOf(Node node) {
        return new RightAnchor(node);
    }
    public static Anchor bottomOf(Node node) {
        return new BottomAnchor(node);
    }
    public static Anchor leftOf(Node node) {
        return new LeftAnchor(node);
    }

    public double distanceTo(Anchor other) {
        double dx = other.x.getReadOnlyProperty().doubleValue() -
            this.x.getReadOnlyProperty().doubleValue();
        double dy = other.y.getReadOnlyProperty().doubleValue() -
            this.y.getReadOnlyProperty().doubleValue();
        return Math.sqrt(dx * dx + dy * dy);
    }

    public ReadOnlyDoubleProperty xProperty() {
        return x.getReadOnlyProperty();
    }

    public ReadOnlyDoubleProperty yProperty() {
        return y.getReadOnlyProperty();
    }

    protected abstract void calcCenter(Bounds bounds);

    public abstract Point2D auxiliaryPoint();


    static class TopAnchor extends Anchor {
        TopAnchor(Node node) {
            super(node);
        }
        protected void calcCenter(Bounds bounds) {
            x.set(bounds.getCenterX());
            y.set(bounds.getMinY());
        }
        public Point2D auxiliaryPoint() {
            return new Point2D(
                    x.getReadOnlyProperty().doubleValue(),
                    y.getReadOnlyProperty().doubleValue() - 50);
        }
    }

    static class RightAnchor extends Anchor {
        RightAnchor(Node node) {
            super(node);
        }
        protected void calcCenter(Bounds bounds) {
            x.set(bounds.getMaxX());
            y.set(bounds.getCenterY());
        }
        public Point2D auxiliaryPoint() {
            return new Point2D(
                    x.getReadOnlyProperty().doubleValue() + 50,
                    y.getReadOnlyProperty().doubleValue());
        }
    }

    static class BottomAnchor extends Anchor {
        BottomAnchor(Node node) {
            super(node);
        }
        protected void calcCenter(Bounds bounds) {
            x.set(bounds.getCenterX());
            y.set(bounds.getMaxY());
        }
        public Point2D auxiliaryPoint() {
            return new Point2D(
                    x.getReadOnlyProperty().doubleValue(),
                    y.getReadOnlyProperty().doubleValue() + 50);
        }
    }

    static class LeftAnchor extends Anchor {
        LeftAnchor(Node node) {
            super(node);
        }
        protected void calcCenter(Bounds bounds) {
            x.set(bounds.getMinX());
            y.set(bounds.getCenterY());
        }
        public Point2D auxiliaryPoint() {
            return new Point2D(
                    x.getReadOnlyProperty().doubleValue() - 50,
                    y.getReadOnlyProperty().doubleValue());
        }
    }
}
Anchor は、ダイアログの上下左右のいずれかに存在するものとして各 Anchor を生成できるようにしました。
Diagram に作成した Anchor を追加します。
public class Diagram extends Pane {

    private List<Anchor> anchors;

    public Diagram(Node node) {
        super(node);
        this.anchors = Arrays.asList(
                Anchor.topOf(this),
                Anchor.rightOf(this),
                Anchor.bottomOf(this),
                Anchor.leftOf(this));
        enableDrag();
    }

    public List<Anchor> anchors() {
        return anchors;
    }
    // ...
}
続いて Anchor 同士を繋ぐ Connector を作成します。
package example.javafx;

import javafx.geometry.Point2D;
import javafx.scene.Group;
import javafx.scene.paint.Color;
import javafx.scene.shape.CubicCurve;
import javafx.scene.shape.Polygon;
import javafx.scene.shape.StrokeLineCap;
import javafx.scene.transform.Rotate;

public class Connector extends Group {

    private Diagram from;
    private Diagram to;
    private CubicCurve curve;
    private Arrow arrow;

    public Connector(Diagram fromDiagram, Diagram toDiagram) {

        from = fromDiagram;
        to = toDiagram;
        curve = new CubicCurve();
        curve.setStroke(Color.FORESTGREEN);
        curve.setStrokeWidth(2);
        curve.setStrokeLineCap(StrokeLineCap.ROUND);
        curve.setFill(null);
        arrow = new Arrow();
        getChildren().addAll(curve, arrow);

        calculate();

        from.boundsInParentProperty().addListener(
                (observableValue, oldBounds, bounds) -> calculate());
        to.boundsInParentProperty().addListener(
                (observableValue, oldBounds, bounds) -> calculate());

    }

    protected void calculate() {

        Anchor start = null;
        Anchor end   = null;
        double distance = Double.MAX_VALUE;

        for (Anchor fromAnchor : from.anchors()) {
            for (Anchor toAnchor : to.anchors()) {
                double len = fromAnchor.distanceTo(toAnchor);
                if (len <= distance) {
                    distance = len;
                    start = fromAnchor;
                    end = toAnchor;
                }
            }
        }

        curve.setStartX(start.xProperty().doubleValue());
        curve.setStartY(start.yProperty().doubleValue());
        curve.setControlX1(start.auxiliaryPoint().getX());
        curve.setControlY1(start.auxiliaryPoint().getY());

        curve.setEndX(end.xProperty().doubleValue());
        curve.setEndY(end.yProperty().doubleValue());
        curve.setControlX2(end.auxiliaryPoint().getX());
        curve.setControlY2(end.auxiliaryPoint().getY());

        arrow.calc(curve, 1);
    }


    class Arrow extends Polygon {

        private Rotate rz;

        public Arrow() {
            super(new double[] { 0, 0, 5, 10, -5, 10 });
            setFill(Color.FORESTGREEN);
            rz = new Rotate();
            rz.setAxis(Rotate.Z_AXIS);
            getTransforms().addAll(rz);
        }

        public void calc(CubicCurve curve, float t) {

            setTranslateX(curve.getEndX());
            setTranslateY(curve.getEndY());

            double size = Math.max(
                    curve.getBoundsInLocal().getWidth(),
                    curve.getBoundsInLocal().getHeight());
            double scale = size / 4d;
            Point2D tan = evalDt(curve, t).normalize().multiply(scale);
            double angle = Math.atan2(tan.getY(), tan.getX());
            double offset = (t > 0.5) ? +90 : -90;
            rz.setAngle(Math.toDegrees(angle) + offset);
        }

        private Point2D evalDt(CubicCurve c, float t){
            return new Point2D(-3 * Math.pow(1 - t, 2) * c.getStartX() +
                    3 * (Math.pow(1 - t, 2) - 2 * t * (1 - t)) * c.getControlX1() +
                    3 * ((1 - t) * 2 * t - t * t) * c.getControlX2() +
                    3 * Math.pow(t, 2) * c.getEndX(),
                    -3 * Math.pow(1 - t, 2) * c.getStartY() +
                    3 * (Math.pow(1 - t, 2) - 2 * t * (1 - t)) * c.getControlY1() +
                    3 * ((1 - t) * 2 * t - t * t) * c.getControlY2() +
                    3 * Math.pow(t, 2) * c.getEndY());
        }
    }
}
Connector は始点となる Diagram のいずれかの Anchor から、終点となる Diagram のいずれかの Anchor を、CubicCurve で接続するものとしました。
CubicCurve を使うことでベジェ曲線が簡単に作れます。
Anchor は、Anchor 間の距離が最も近いもの同士を選択し、CubicCurve で繋ぐようにしています。
また、Arrow にて Anchor の終点に矢印を表示するようにしました。
App クラスを以下のように修正して実行してみましょう。
public class App extends Application {
    @Override
    public void start(Stage stage) {
        // ...

        Diagram d1 = createDiagram("Diagram1");
        Diagram d2 = createDiagram("Diagram2");

        canvas.getChildren().addAll(d1, d2, new Connector(d1, d2));
        // ...
    }
}
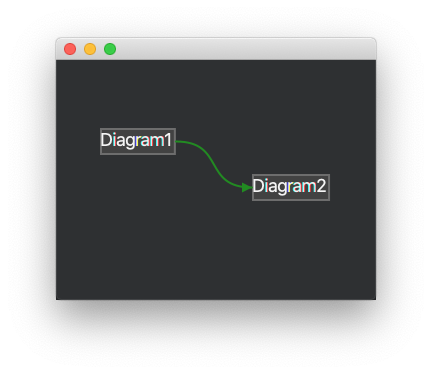
以下のように Diagram をコネクタ接続することができました。

クラス図の表示
大枠は完成したので、クラス図を書いてみましょう。
App クラスを以下のように書き換えます。
package example.javafx;

import javafx.application.Application;
import javafx.geometry.Bounds;
import javafx.geometry.Insets;
import javafx.scene.Node;
import javafx.scene.Scene;
import javafx.scene.layout.HBox;
import javafx.scene.layout.Pane;
import javafx.scene.layout.VBox;
import javafx.scene.paint.Color;
import javafx.scene.text.Font;
import javafx.scene.text.Text;
import javafx.stage.Stage;

public class App extends Application {

    @Override
    public void start(Stage stage) {

        Pane canvas = new Pane();
        canvas.setPrefSize(680, 500);
        canvas.setStyle("-fx-background-color: #2e3032;");

        Diagram d1 = createDiagram("Employee", "id: Long", "name: String", "salary: Money");
        Diagram d2 = createDiagram("Department", "id: Long", "name: String");
        Diagram d3 = createDiagram("Address", "id: Long", "code: String", "street: String", "city: String", "state: String");
        Diagram d4 = createDiagram("Project", "id: Long", "name: String");

        canvas.getChildren().addAll(d1, d2, d3, d4,
                new Connector(d1, d2),
                new Connector(d2, d3),
                new Connector(d1, d4));

        Scene scene = new Scene(canvas);
        stage.setScene(scene);
        stage.show();

        liningUp(canvas.getBoundsInLocal(), d1, d2, d3, d4);
    }

    private Diagram createDiagram(String name, String... props) {

        VBox vbox = new VBox();
        vbox.setStyle(
                "-fx-border-color: #6d6d6d;" +
                "-fx-border-width: 2;");

        HBox header = createRow(name);
        header.setStyle(
                "-fx-background-color: #424242;" +
                "-fx-border-width: 0 0 1 0;" +
                "-fx-border-color: #6d6d6d;");
        vbox.getChildren().add(header);

        for (String prop : props) {
            vbox.getChildren().add(createRow(prop));
        }

        return new Diagram(vbox);
    }

    private HBox createRow(String name) {

        Text text = new Text(name);
        text.setFont(new Font(18));
        text.setFill(Color.web("#a9b7c6"));

        HBox hbox = new HBox(5);
        hbox.setPadding(new Insets(4, 10, 4, 10));
        hbox.setStyle("-fx-background-color: #2e3032;");
        hbox.getChildren().add(text);

        return hbox;
    }

    private void liningUp(Bounds canvas, Node... nodes) {
        float margin = 50;
        double rowHeight = 0;
        double x = margin, y = margin;
        for (Node node : nodes) {
            if (x + node.getBoundsInLocal().getWidth() > canvas.getWidth()) {
                x = margin;
                y += rowHeight + margin + margin;
            }
            node.relocate(x, y);
            if (node.getBoundsInLocal().getHeight() > rowHeight) {
                rowHeight = node.getBoundsInLocal().getHeight();
            }

            x += node.getBoundsInLocal().getWidth() + margin + margin;
        }
    }

    public static void main(String[] args) {
        launch();
    }
}
少し長くなりましたが、やっていることは createDiagram() で Diagram を生成してコネクタの接続を定義しているだけです。
ダイアグラムを作成したら liningUp() にてダイアグラムの初期位置を整列しています。
実行すると以下のようにクラス図っぽいダイアグラムが表示されます。

まとめ
JavaFX で簡単なダイアグラムを表示してみました。
少し拡張すれば、クラスファイルからクラス図を表示したり、DDL から ER図を生成したりといったことも比較的簡単に実現できます。
JDK に同梱されなくなった JavaFX ではありますが、UI ライブラリとしても成熟しており、また触っていて楽しいので、みなさんも触ってみてはいかがでしょうか?

Mastering JavaFX 10: Build advanced and visually stunning Java applications (English Edition)
- 作者:Grinev, Sergey
- 発売日: 2018/05/31
- メディア: Kindle版
